Go Back
Earlier studies related to the transiogram
Some earlier studies on spatial transition probability-lag curves or functons could be regarded as pioneer studies related to transiograms. These pioneer studies should be respected even if they were preliminary, or might not be crucial to the MCRF approach. In our opinion, the pioneer studies related to transiograms should be those studies that demonstrated or explored the properties, characteristics, modeling and applications of transition probability-lag curves and functions. Those studies that only simply mentioned or used transition probabilities are not much relevant. As to bivariate conditional probabilities, they are mostly even not transition probabilities. A transition probability is a bivariate two-point conditional probability of state variables of a spatiotemporal stochastic process. Its meaning is connected with the Markov chain theory. Here we specifically provide an introduction to related pioneer studies in geosciences that have gotten our attentions in recent years. In fact, most of them were mentioned in our first published full paper for specifically introducing transiograms - Li (2007). The paper of Li (2007) integrated main contents of three manuscripts submitted to different journals (under the suggestion of the editor) and experienced a long revision process.
The proposition of the transiogram concept was a sudden idea when I was thinking about how to deal with scattered point sample data in multi-dimensional Markov chain modeling, inspired by the variogram concept and also for the convenience of description. The concept did not deny or conflict with any earlier study in transition probability-lag curves or functions in geosciences. With the reference of the variogram and the knowledge in transition probability as well as some new ideas, we developed the transiogram into a set of methods (a basically complete methodology) for parameter estimation for implementing the Markov chain spatial models we developed. The major difficult thing for the transiogram is how to properly infer an entire set of practical transiogram models (i.e., corregionalization of multiple classes) for implementing the MCRF approach. Earlier studies in transition probability-lag functions and curves did not provide a practical method for use in the MCRF approach. In addition, earlier studies also did not provide a unique term for transition probability-lag functions and curves.
In recent years, we made repetitive investigations for earlier studies related to transition probability-lag curves and functions, to carefully check whether some studies have done somethings before ours but we did not know. We would like to recognize the priority of any pioneer studies in concepts, models and joint modeling methods for the transiorgam methodology, if they were not sufficiently recognized in Li (2007). We found that the major earlier studies related to the transiogram were Luo's work and Carle-Fogg's work done in 1990s. But it should be Schwarzacher who first demonstrated a couple of transition probability-lag curves in 1969. Schwarzacher's work was mentioned and Carle-Fogg's work were emphasized and reviewed in Li (2007). However, unfortunately Luo's work was not mentioned in Li (2007). But it was mentioned later in our other related papers.
Here we would like to point out the fact that, for the MCRF approach, the transiogram is not simply a transition probability-lag function expression or a different name for spatial transition probabilities. First, it is the basic component of simplified MCRF models based on the spatial conditional independence assumption of nearest neighbors. Second, it is a methodology for parameter estimation to implement the MCRF models, particuarly for joint modeling of experimental transiograms. Therefore, the transiogram is indispensable to the MCRF approach. As a concept mainly suggested for the MCRF approach, we welcome other researchers to use it in their studies or in other approaches if they think it is more convenient to express transition probability-lag curves and fucntions, but whether other approaches adopt it or not is not up to us.
Schwarzacher's studies
Schwarzacher (1969) probably is the first paper that displayed transition probability-lag curves. The curves were calculated using a one-step transition probability matrix through self-multiplications (i.e., powered transition probability matrix). No transition probability-lag function expressions and whole sets of transition probability-lag curves were provided. A transition probability-lag curve was also shown in Ethier (1975). Such kind of transition probability-lag curves was called "idealized transiograms" in Li (2007). Below Figure 1 shows the transition probability-lag curves and the statements about their inference, copied from Schwarzacher (1969).
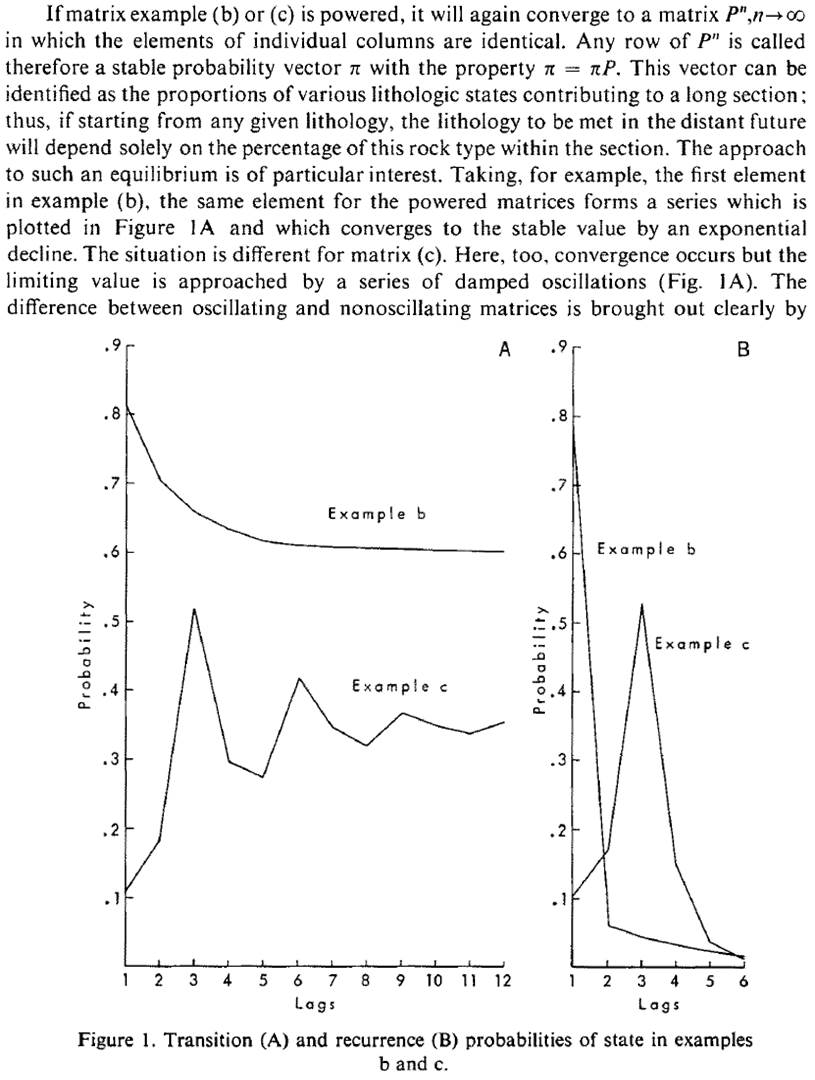
Figure 1. Transition probability-lag curves (A - left chart) shown in Schwarzacher (1969) with statements about how they were obtained.
Luo's studies
Luo (1993, 1996) might be the first who suggested using spatial transiton probability-lag functions to describe spatial auto and cross correlations of categorical fields (see Figure 2). However, what Luo emphasized was the "Markov diagrams of k-step transition probabilities pij(kh)". Luo demonstrated multiple subsets of Markov diagrams in his paper (see Figure 3). These Markov diagrams were calculated from a one-step transition probability matrix through self-multiplications. Such Markov diagrams were called "discrete-lag Markov chain models" in Carle and Fogg (1997), and "idealized transiograms" in Li (2007). In addition, Luo (1993) and Luo and Thomsen (1994) also studied the relationships between spatial transition probability and other spatial correlation measures such as indicator variograms and bivariate joint probabilities.
![]()
Figure 2. Spatial transition probability-lag function stated in Luo (1996).
Figure 3. Some Markov diagrams presented in Luo (1996).
Carle and Fogg's studies
Carle and his collaborators did more important and abundant pioneer studies (see Figures 4 and 5). They estimated transition probability-lag curves from borehole data, suggested the transition rate method for deriving transition probability models, studied some properties of spatial transition probability functions, and cearly presented the quantitative relationsips of transition probabilities with indicator variograms and indicator covariance (Carle and Fogg 1996, 1997). The transition rate method was used in application studies of the transition probability-based indicator geostatistics (or simply "transition probability geostatistics" - TPROGS) they suggested based on indicator kriging (see Carle and Fogg 1996; Weissmann and Fogg 1999, Weissmann et al. 1999). The sets of transition probability models derived using the transition rate method were called "continuous-lag Markov chain models" in Carle and Fogg (1997). "Continuous-lag Markov chain models" have some advantages over "discrete-lag Markov chain models" due to their continuity and the fact that they can incorporate expert knowledge more easily. But in our opinion, they were still idealized curves because they were calculated using equations based on the first-order stationary Markov assumption of data and shown to be similar in shape to "discrete-lag Markov chain models". Therefore, "continuous-lag Markov chain models" were grouped into "idealized transiograms" in Li (2007, p.884). Although not clearly addressed, Carle and Fogg (1996) also suggested another joint modeling method for estimated transition probability-lag curves, called "random transition probability model". Probably because the method is not practical (it assumed the same mathematical model and correlation range for each matrix row of transition probability-lag models), it was not used in later studies. However, this means that they should be the first who attempted to use mathematical models in transition probability modeling. The use of expert knowledge in facies mean lengths to transiton probability modeling is an interesting point in their work for modeling subsurface facies. It seems that the transition rate method could provide a good fit to most transtion probbaility-lag curves in the vertical direction that are estimated from a number of borehole logs. But some literature shows that deviations could be very large sometimes, especially when it was used to fit transtion probbaility-lag curves estimated in horizontal dimenions.
![]()
Figure 4. Spatial transition probability-lag function presented in Carle and Fogg (1996).
Figure 5. Transition probabilities estimated from borehole data and fitted "continous-lag Markov chain models" shown in Carle and Fogg (1997).
Ritzi's study
Following the Carle-Fogg's work and variogram modeling, Ritzi (2000) explicitly provided several auto transition probability models in a table when studying the behavior of indicator variograms and transition probabilities in relation to the variance in lengths of hydrofacies.
Other studies
Deutsch and Journel (1998, p.166) mentioned that the two-point histogram for post-processing with simulated annealing was a set of bivariate transition probabilities, but the presented function expression was actually a two-point joint probability function. The same content should also appear in Deutsch and Journel (1992), an earlier version of the book, but maybe with different page number. In the extended coupled Markov chain model (Elfeki and Dekking 2001), "k-step transition probabilities" were directly embedded in model equations and calculated using a one-step transition probability matrix. There were no other contents specifically related to transition probability-lag curves and transition probability-lag functions in these earlier studies.
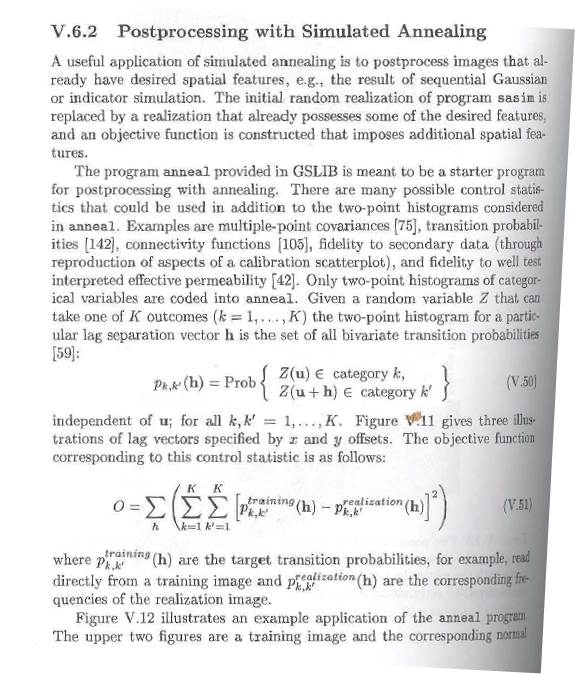
Figure 6. Two-point histogram for postprocessing with simulated annealing in Deutsch and Journel (1998).
Why did we not adopt earlier terms for transition probability-lag functions and curves
The names used for transition probability-lag functions and curves in earlier studies are not identical, and there was also not a specific name (like "variogram") to represent both transition probability-lag functions and transition probability-lag curves. In fact, earlier studies, as introduced above, had not well established a proper and complete concept system (similar to that for variogram) nor a practical approach for transiogram modeling from sample data, particularly joint modeling, for use in the MCRF approach.
"Markov diagram" or "transition probability diagram" may be a good term for transition probability-lag curves, but they were actually traditionally used to refer to the graphs of transition probabilities between different states in non-spatial or 1D Markov chains. A "transition probability" traditionally means a single value (this is similar to "semivariance"). Using "discrete-lag Markov chain models" and "continuous-lag Markov chain models" or simply "Markov chain models" to name lagged spatial transition probabilty models is not suitable for a Markov chain approach like the MCRF approach, because they can be easily confused with the multi-dimensional Markov chain models for spatial simulations. In addition, these terms are not unique. The "transiogram" term can be used uniquely to represent all transition probability-lag curves and functions and also can avoid confusions, while it is easy to be used and understood due to the reference effect of the variogram. Considering the inspiration of the variogram to the transiogram, following the style of the variogram as much as possible in concepts and modeling of the transiogram, we believe, is also a respect to classical geostatistics. Although we did not adopt those terms (i.e., Markov diagram, continuous-lag Markov chain model) used in related earlier studies, these pioneer studies were recognized in our research.
Figure 7. A typical Markov diagram, which means something different from transition probability-lag curves.
Remarks
The transiogram was proposed as the bivariate two-point spatial correlation measure of categorical fields for Markov chain geostatistics (i.e., the MCRF approach), based on pioneer studies and the variogram theory. It is also a natural choice for Markov chain spatial models that need to use multiple-step or continuous-lag transition probabilities. Although it was initially proposed for simplified MCRF models, the term and related modeling methods may also be used in some other spatial statistical models/approaches, if one would like. The transiogram is not just a short-name for transition probability-lag functions and curves. It is also not just a transition probability-lag function, a transition probability-lag curve, or a symbol like pij(h) or tij(h). It is a methodology with its nomenclatures. It has a whole set of concepts (its terminology), properties, constraint conditions, estimation methods from sample data and/or domain knowledge, mathematical models, joint modeling methods, and interpretations of physical and statistical meanings of categorical landscape features, as presented in a series of articles about transiograms (Li 2006; Li 2007; Li and Zhang 2010; Li et al. 2012). Without these, it does not have much meaning and value. The most important are the modeling methods, which provide the transition probability values needed by spatial statistical models. Most of these were summarized and contributed by Steven F. Carle and Weidong Li. Li finally coined the term "transiogram" with a set of concepts, systematically summarized the properties, features and models of transiograms, and further suggested some flexible models and joint modeling methods. Carle's work was apparently driven by his effort in effectively implementing full indicator kriging for modeling lithofacies (which seemed difficult to effectively implement previously), while Li's work was driven by his effort in implementing the MCRF model he proposed (which was initially for solving the small class underestimation problem of the coupled Markov chain model and then for extending a 1D Markov chain into a generalized geospatial statistical approach for simulating categorical fields, mainly soil and land cover classes). It seems that transition probability-lag functions and curves (even transition probabilities and bivariate conditional probabilities) got much attention in geostatistics after the MCRF model (with the transiogram concept) was proposed.
In fact, the transiogram concept was initially proposed with the MCRF model (at beginning it was called "spatial Markov chain models") together as a part of the MCRF model. At that time, the transiogram only had two meanings and usages: a shortname for convenience of description in articles, and a method (i.e., the math model joint fitting method) for estimating transition probability values for implementing the MCRF model. Months later, I felt it might be a good idea and also necessary to give the transiogram a comprehensive description as a general spatial correlation measure for categorical data. With this idea and manuscript preparation, it was necessary to collect and carefully read some articles that were possibly related with transition probability-lag curve and function, and address the major properties of transiograms and related methods for generating transiogram curves/models. I had to say that Carle and Fogg's studies were impressive. My work for comprehensively describing the transiogram might not be thorough and perfect, but I had done my best at that time. So far, we have not used the transition rate method suggested in Carle and Fogg (1997) to our studies. Because I never explored the TPROGS software, I even did not know how it works (I indeed asked Carle for the TPROGS software in about April 2004, but that was done for somebody in China Agricultural University who wanted to use the software and requested me to help get it). But it was obvious that (1) the transiogram models generated by the transition rate method (see Weissmann and Fogg 1999) are relatively oversimple if they were used for simulating ground surface landscape classes, (2) the transition rate method for calculating the transiogram models is based on the stationary Markovian assumpton, and (3) Carle and Fogg (1996) clearly presented that they were using transition probabilities to implement indicator kriging models for 3D modeling of lithofacies, where the borehole data are usually insufficient for estimating reliable experimental transiograms and thus horizental transiogram models have to be inferred from vertical transiogram models.
Note that Li (2006) is a technical note, which was published to replace a previously-submitted full manuscript. It seems its publication was not necessary because I had a lengthy full article about transiogram on another journal. However in the situation at that time, its publication should be necessary. I thank the then-editor of the journal for his help.
References:
Carle SF, Fogg GE (1996) Transition probability-based indicator geostatistics. Math Geol 28(4): 453-476.
Carle SF, Fogg GE (1997) Modeling spatial variability with one- and multi-dimensional continuous Markov chains. Math Geol 29: 891–918.
Deutsch CV, Journel AG (1998) GSLIB: Geostatistics software library and user’s guide. 2nd ed. New York: Oxford University Press.
Ethier, VG (1975) Application of Markov analysis to the Banff formation (Mississippian), Alberta. Math Geol 7(1): 47-61.
Li W (2006) Transiogram: A spatial relationship measure for categorical data. Inter J Geogr Info Sci 20(6): 693-699.
Li W (2007) Transiograms for characterizing spatial variability of soil classes. Soil Sci Soc Am J 71: 881-893.
Li W, Zhang C (2010) Linear interpolation and joint model fitting of experimental transiograms for Markov chain simulation of categorical spatial variables. Int J Geogr Info Sci 24: 821–839.
Li W, Zhang C, Dey DK (2012) Modeling experimental cross-transiograms of neighboring landscape categories with the gamma distribution. Inter J Geogr Info Sci 26(4): 599-620.
Luo J (1993) Konditionale Markovsimulation 2-dimensionaler geologischer probleme. Berliner Geowissenschaftliche Abhandlungen, Reihe D, Band 4, Berlin.
Luo J (1996) Transition probability approach to statistical analysis of spatial qualitative variables in geology. In: Forster A, Merriam DF (eds.) Geologic modeling and mapping (Proceedings of the 25th Anniversary Meeting of the International Association for Mathematical Geology, October 10-14, 1993, Prague, Czech Republic). Plenum Press, New York. p. 281–299.
Luo J, Thomsen A (1994) On direct estimation of the bivariate probability distribution of a regionalized variable from its spatial samples. In: Fabbri AG, Royer JJ (eds.) The 3rd CODATA conference on geomathematics and geostatistics. Sci. de la Terre, Ser. Inf., Nancy. 32: 115-123.
Ritzi RW (2000) Behavior of indicator variograms and transition probabilities in relation to the variance in lengths of hydrofacies. Water Resour Res 36: 3375–3381.
Schwarzacher W (1969) The use of Markov chains in the study of sedimentary cycles. Math Geol 1:17–39.
Weissmann GS, Fogg GE (1999) Multi-scale alluvial fan heterogeneity modeled with transition probability geostatistics in a sequence stratigraphic framework. J Hydrol 226: 48–65.
Weissmann GS, Carle SF, Fogg GE (1999) Three‐dimensional hydrofacies modeling based on soil surveys and transition probability geostatistics. Water Resour Res 35(6): 1761-1770.