Land Cover Change Statistics of Connecticut
CT Land Cover Change, 1985-2010
1985 |
1990 |
2002 |
2006 |
2010 |
Change |
sq. miles | sq. miles | sq. miles | sq. miles | sq. miles | sq. miles | % of state |
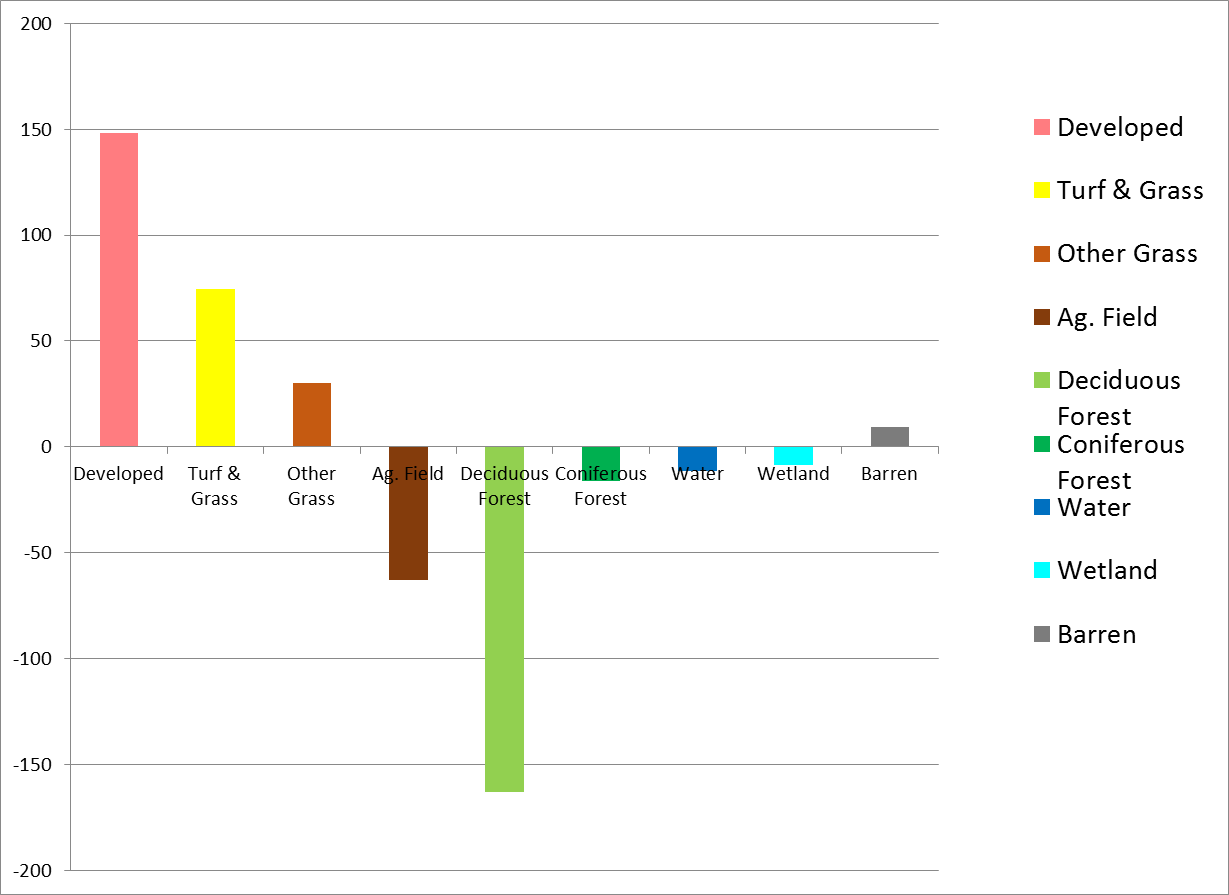
| Developed | 793.4 | 862.3 | 885.5 | 922.8 | 942.1 | +148.8 | +3.0% |
| Turf & Grass | 308.9 | 325.9 | 341.7 | 362.5 | 381.7 | +72.8 | +1.5% |
| Other Grasses | 65.3 | 68.7 | 76.1 | 82.4 | 91.0 | +25.7 | +0.5% |
| Agricultural Field | 425.2 | 403.9 | 391.8 | 371.8 | 363.4 | -61.8 | -1.2% |
| Deciduous Forest | 2467.0 | 2410.5 | 2379.7 | 2338.2 | 2300.3 | -166.8 | -3.3% |
| Coniferous Forest | 455.9 | 452.4 | 449.5 | 445.2 | 439.1 | -16.8 | -0.3% |
| Water | 173.1 | 168.8 | 164.1 | 161.1 | 161.2 | -11.9 | -0.2% |
| Non-forested Wetland | 20.2 | 21.2 | 21.2 | 21.7 | 21.1 | +1.0 | 0.0% |
| Forested Wetland | 183.8 | 177.8 | 174.9 | 173.8 | 173.7 | -10.1 | -0.2% |
| Tidal Wetland | 22.6 | 22.9 | 23.0 | 23.2 | 22.9 | +0.3 | 0.0% |
| Barren | 32.1 | 37.3 | 44.4 | 49.1 | 51.4 | +19.2 | +0.4% |
| Utility (Forest) | 17.6 | 17.3 | 17.3 | 17.0 | 17.1 | -0.5 | 0.0% |
Change in Zone Land Cover, 1985-2010, square miles |
 |